Mastering Support and Resistance Levels
Support and resistance lines are foundational tools in technical analysis. They help traders identify potential reversal points, price consolidation areas, and key levels where buying or selling pressure could dominate. Let’s break down the process of drawing these lines step-by-step.
What Are Support and Resistance?
- Support: A price level where buying pressure is strong enough to prevent the price from falling further. It acts as a “floor”.
- Resistance: A price level where selling pressure is strong enough to prevent the price from rising further. It acts as a “ceiling”.
Steps to Draw Support and Resistance Lines
1. Choose the Right Timeframe
Select a timeframe based on your trading style:
Day traders: 5-minute, 15-minute, or hourly charts.
Swing traders: Daily or weekly charts.
Investors: Weekly or monthly charts.
Higher timeframes (daily, weekly) often provide stronger support and resistance levels due to more significant market participation.
2. Identify Key Swing Points
Look for areas where the price has reversed multiple times:
Support: Price bounces off the same level during downtrends.
Resistance: Price stalls or reverses at the same level during uptrends.
Focus on recent swing highs and lows for current relevance.
3. Use Horizontal Lines
On your charting platform, use the horizontal line tool to mark the levels where price has:
Touched and rebounded (support).
Reached and been rejected (resistance).
Make sure these lines align with multiple points to increase their validity.
4. Check Volume at Levels
Higher volume at a support or resistance level strengthens its reliability.
If a level breaks with significant volume, it may signal a continuation or reversal.
5. Validate with Candlestick Patterns
Confirm support and resistance with candlestick patterns:
Support: Look for bullish reversal patterns (e.g., hammer, bullish engulfing).
Resistance: Look for bearish reversal patterns (e.g., shooting star, bearish engulfing).
6. Extend Lines Across Time
Draw lines across the chart to see if they align with past price action. Historical levels can remain relevant for future trading decisions.
Pro Tips for Drawing Effective Lines
Focus on Major Levels First
Identify strong levels that coincide with psychological prices (e.g., $50, $100) or Fibonacci retracement levels.
Keep It Simple
Avoid cluttering your chart with too many lines. Focus on the most significant levels.
Reassess Regularly
Markets evolve. Continuously update your support and resistance levels as new data becomes available.
ITL's Way of Drawing Support and Resistance Lines
Drawing support and resistance lines is a critical skill for traders, and at Independent Traders Lab (ITL), we emphasize a systematic approach to ensure accuracy and clarity. Here’s our step-by-step process:
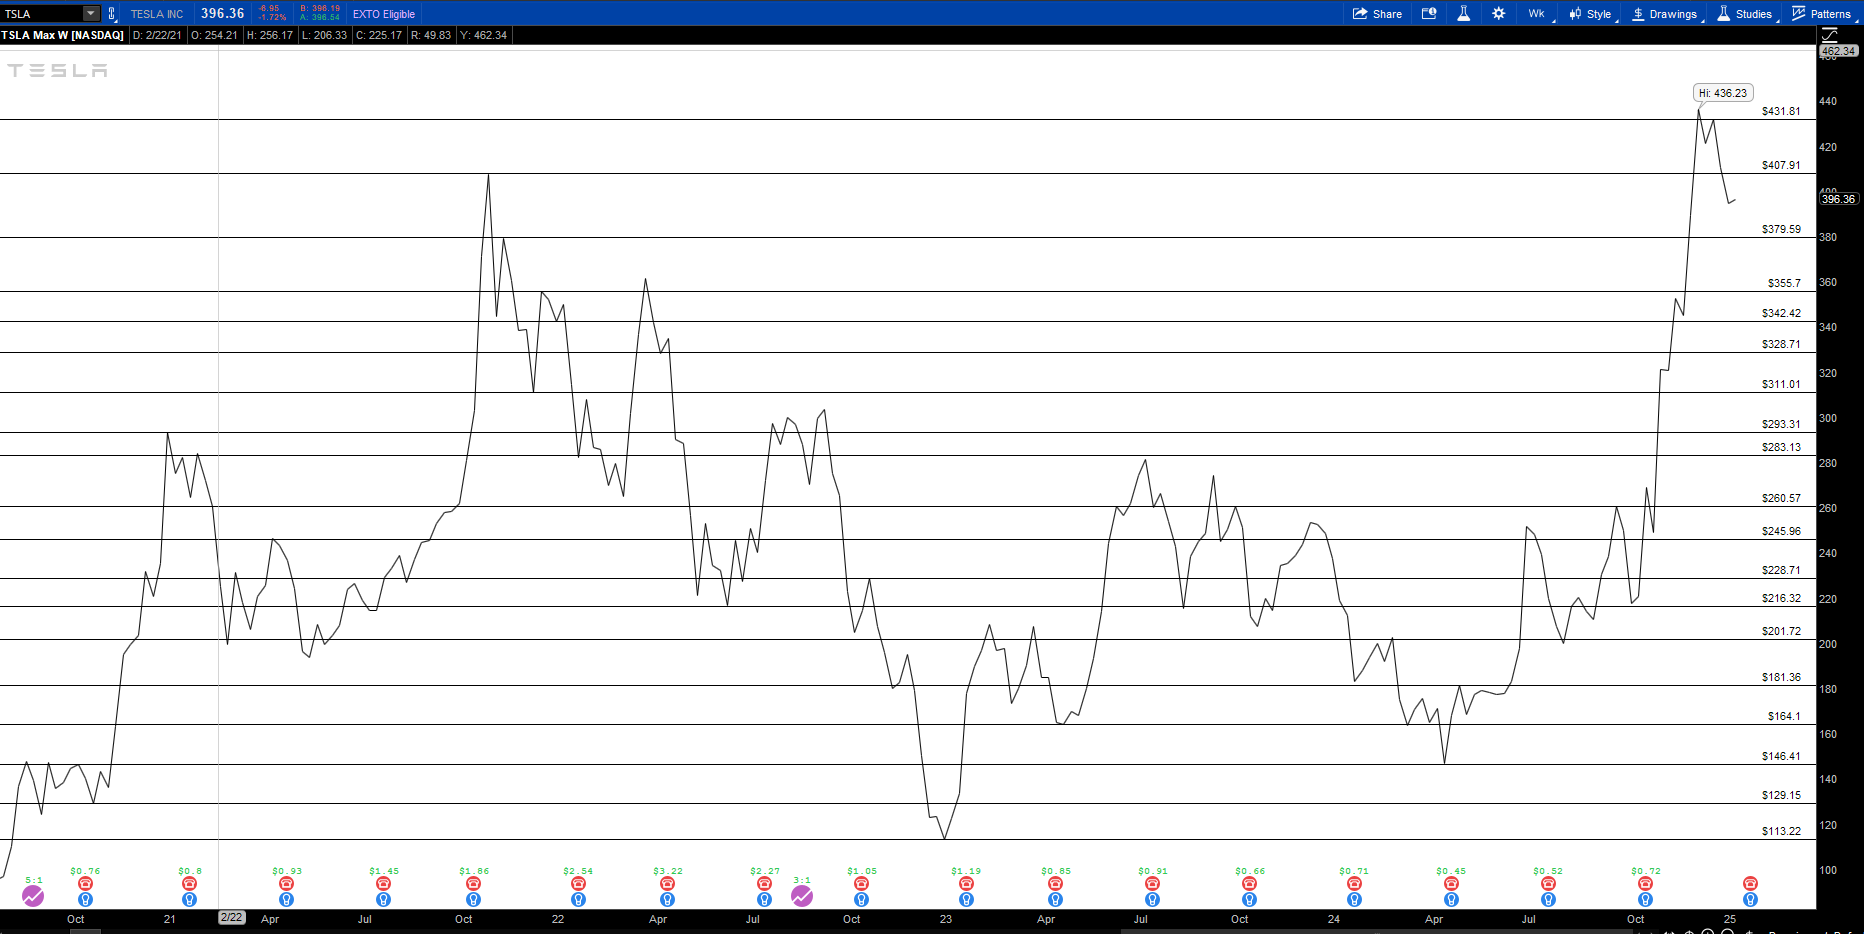
Step 1: Start with a Line Chart on a Higher Timeframe
Select a Weekly Line Chart:
Begin with a higher timeframe, such as a weekly line chart, to get a broader view of the market.
The line chart removes the noise of candlestick wicks and focuses on closing prices, which are more reliable for identifying key levels.
Draw Horizontal Lines at Key Levels:
Look for levels where the line chart touches multiple points, indicating repeated interactions.
Draw horizontal lines through these points to mark potential support and resistance.
Ensure the lines align with at least 3 or more touches to increase their validity.
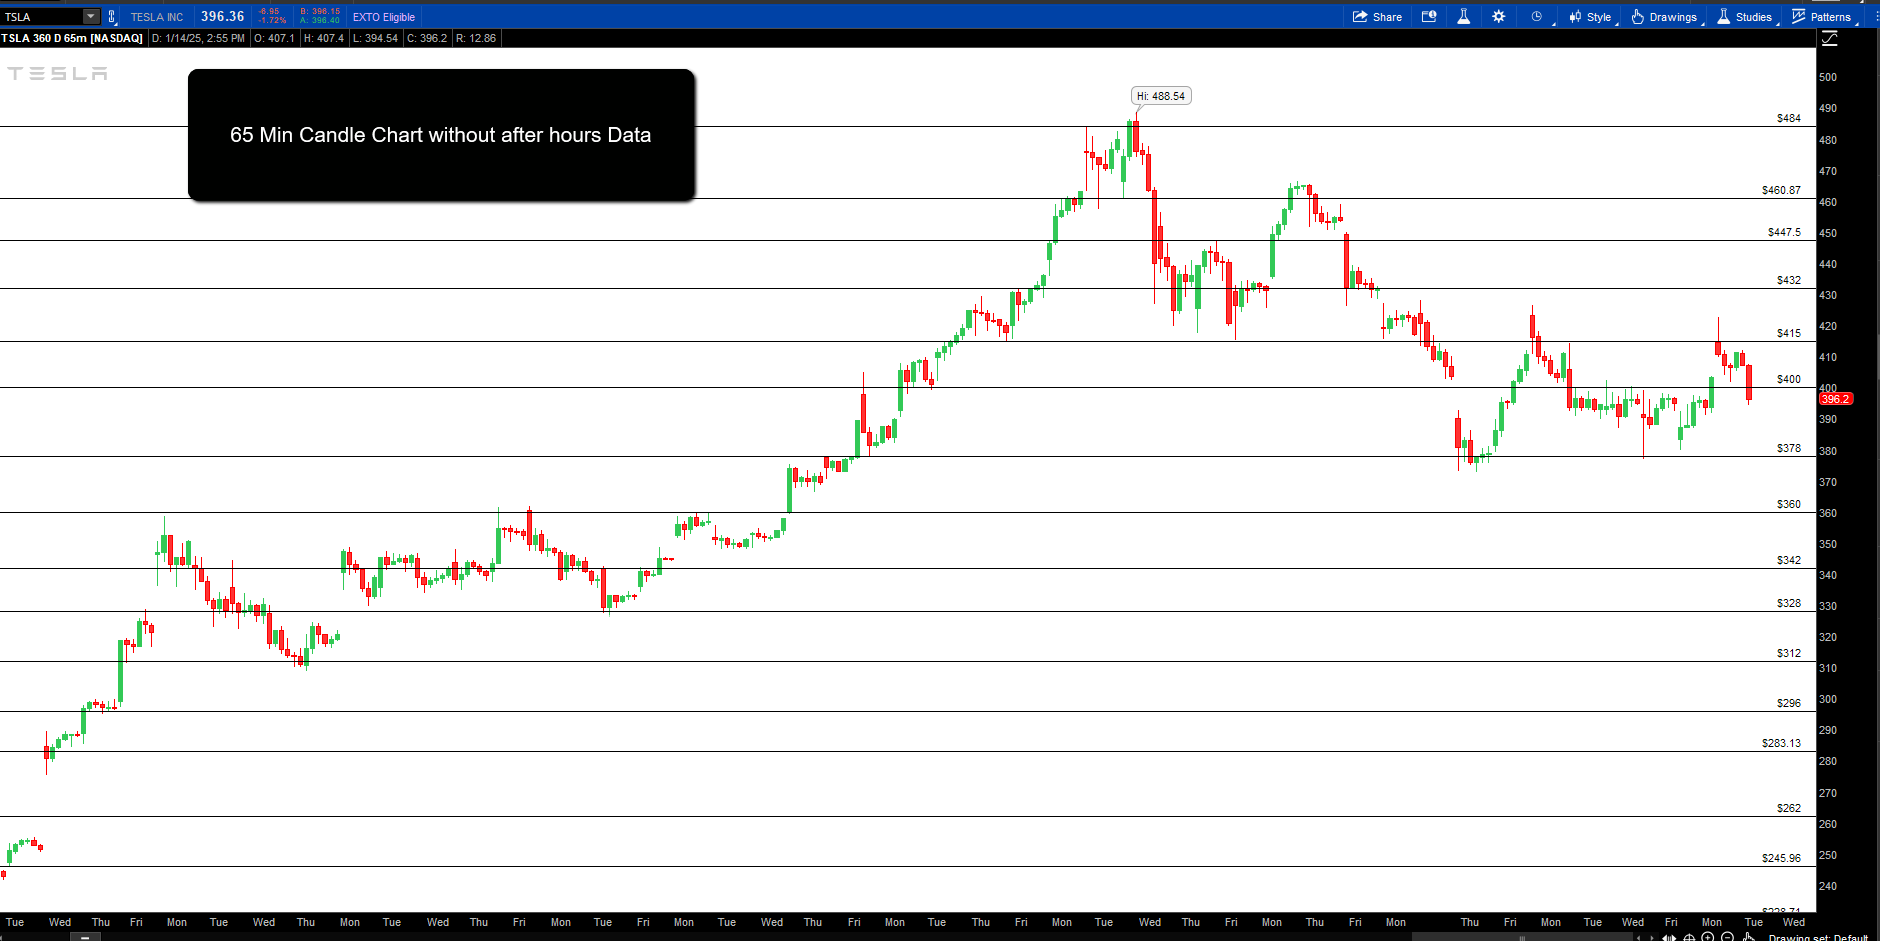
Step 2: Switch to a 65-Minute Candle Chart
Why a 65-Minute Chart?
A 65-minute chart divides the regular trading session (6.5 hours) into exactly 6 candles per day, providing uniform data points for better analysis.
This timeframe offers more precision than traditional hourly charts while maintaining clarity.
Turn Off After-Hours Data:
After-hours trading often introduces unnecessary noise. Disabling it ensures you focus solely on the regular session data, which holds more weight for key levels.
Adjust Weekly Lines to Match Candle Data:
Refine the horizontal lines you drew on the weekly chart to align with the 65-minute candle highs and lows.
Focus on areas where candles show clear reversals, consolidation, or multiple touches near your pre-drawn levels.
Incorporate the wicks and bodies of candles to ensure precision.
Conclusion
These lines are drawn in addition to supply and demand zones as discussed in the previous lesson. Sometimes, the price reverses before reaching the actual supply or demand zones, and other times, it breaches these zones briefly before reversing. By using ITL’s way of drawing support and resistance lines, you ensure that those areas of price action not covered by zones are accounted for.
In the upcoming lessons, we will dive deeper into how to effectively use supply and demand zones alongside support and resistance lines to create a more comprehensive and reliable trading strategy. Stay tuned to master the synergy of these tools and elevate your trading to the next level!